Abstract
Species distribution data provide the foundation for a wide range of ecological research studies and conservation management decisions. Two major efforts to provide marine species distributions at a global scale are the International Union for Conservation of Nature (IUCN), which provides expert-generated range maps that outline the complete extent of a species' distribution; and AquaMaps, which provides model-generated species distribution maps that predict areas occupied by the species. Together these databases represent 24,586 species (93.1% within AquaMaps, 16.4% within IUCN), with only 2,330 shared species.
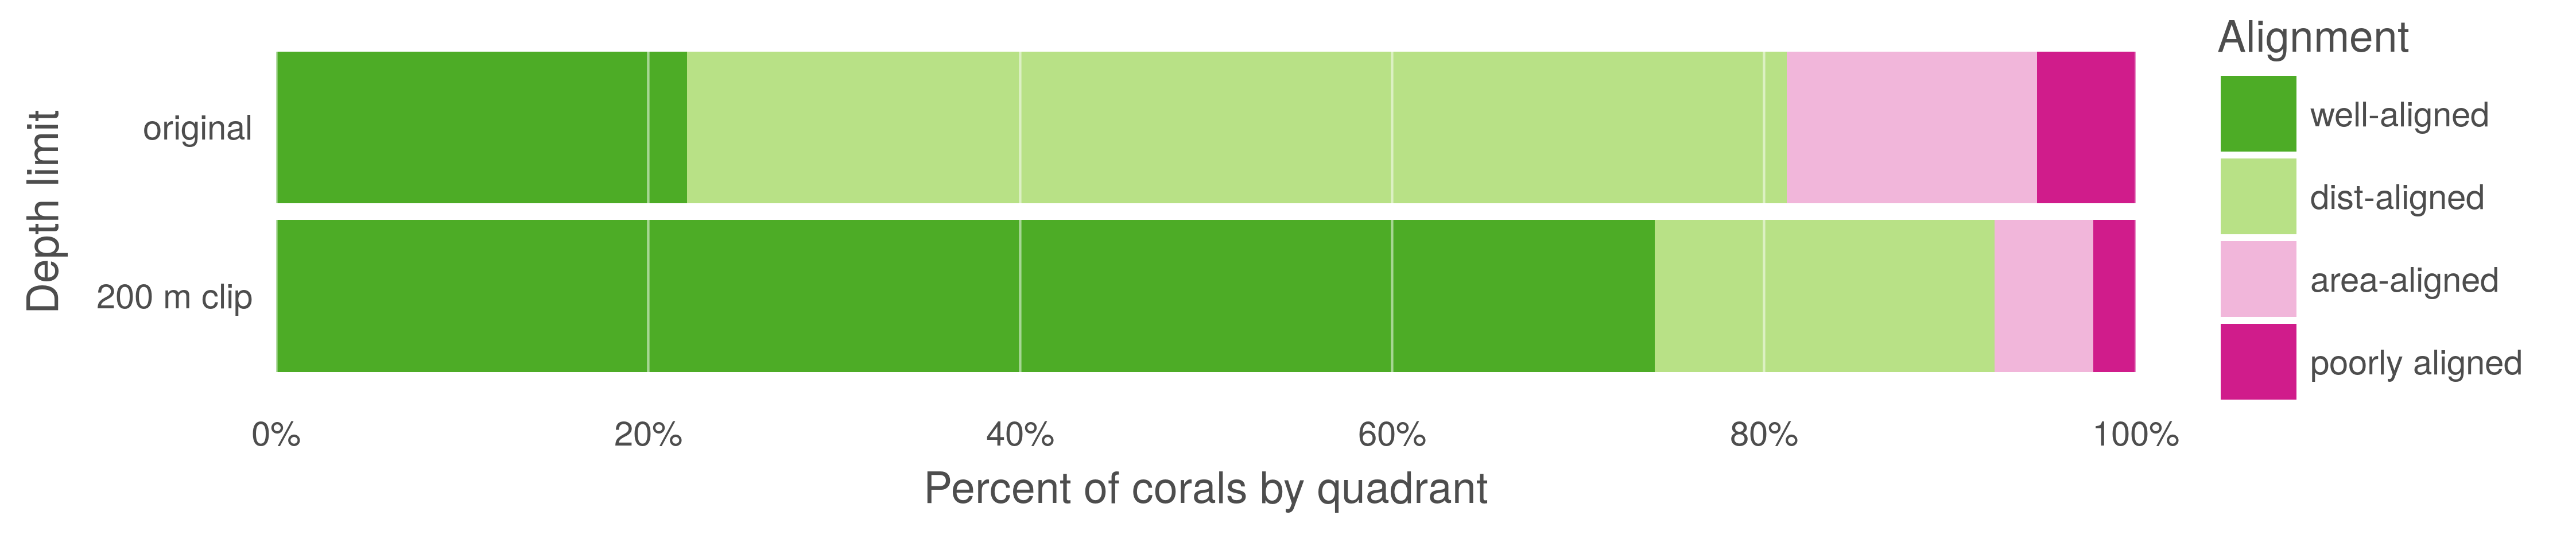
Differences in intent and methodology can result in very different predictions of species distributions, which bear important implications for scientists and decision makers who rely upon these datasets when conducting research or informing conservation policy and management actions. Comparing distributions for the small subset of species with maps in both datasets, we found that AquaMaps and IUCN range maps show strong agreement for many well-studied species, but our analysis highlights several key examples in which introduced errors drive differences in predicted species ranges. In particular, we find that IUCN maps greatly overpredict coral presence into unsuitably deep waters, and we show that some AquaMaps computer-generated default maps (only 5.7% of which have been reviewed by experts) can produce odd discontinuities at the extremes of a species’ predicted range.
We illustrate the scientific and management implications of these tradeoffs by repeating a global analysis of gaps in coverage of marine protected areas, and find significantly different results depending on how the two datasets are used. By highlighting tradeoffs between the two datasets, we hope to encourage increased collaboration between taxa experts and large scale species distribution modeling efforts to further improve these foundational datasets, helping to better inform science and policy recommendations around understanding, managing, and protecting marine biodiversity.